In Freedom Investing 2012 I analyzed the latest Index of Economic Freedom from The Heritage Foundation. Here I present some of the analysis for returns over the past 1-year.
I took 17 of the developed countries with the largest investable markets and compared their current economic freedom score with their returns over the past 1, 3, 5 and 10 years. Only five of these countries are ranked in the free category: Hong Kong, Singapore, Australia, New Zealand and Switzerland. Canada moved from free to mostly free this year. Two years ago the United States fell out as well.
The nations in my analysis included 17 different developed countries representing 85% of the world’s investable markets and 98% of the developed countries. Freedom scores ranged from #1 in freedom Hong Kong at 89.9 to #92 ranked mostly unfree Italy at 58.8.
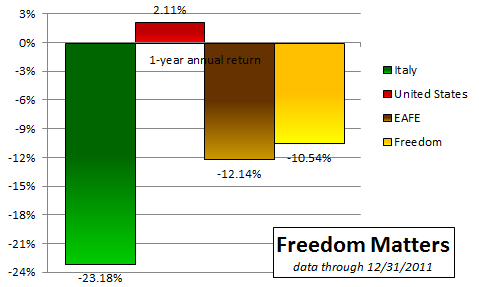
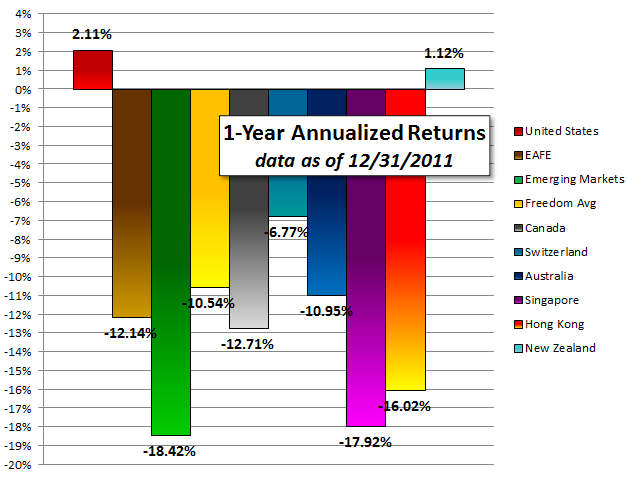
This was a terrible year for the global markets. The MSCI EAFE index fell 12.14% while the emerging markets dropped 18.42%. The United States bucked the trend and finished the year up 2.11%. Italy finished down 23.18%.

The six countries with the most economic freedom (Hong Kong, Singapore, Australia, New Zealand, Switzerland and Canada) averaged down only 10.54% beating the MSCI EAFE Index by 1.60%. Canada started at the bottom of the “free” category and finished at the top of the “mostly free” category. It is included as one of the freest 6 countries in the chart above. Here is a chart showing each country’s 1 year return:

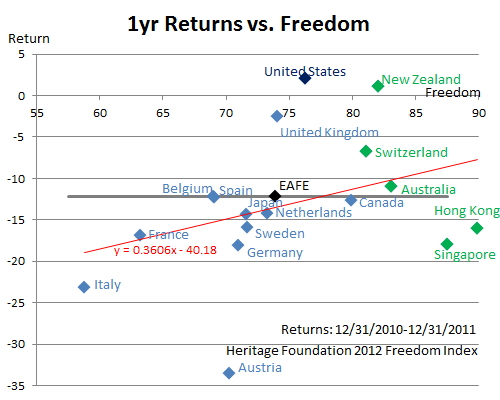
Even though results were mixed for the 1-year returns, freedom investing still boosted returns. Looking at the 1-year returns of all 17 of the developed countries in the analysis verses their freedom index show the following correlation:

The equation of the trend line shows that every point on the freedom index was worth 0.36% annual return over the past year.
The United States’ 2012 Economic Freedom score is now 76.3, down 1.5 from last year. That drop is worth 0.54% of expected annual return. This is despite the fact that the United States returns were higher than the trend line. In the next few posts I will look at the past 3- 5- and 10-year returns. The United States has been dropping in economic freedom since peaking at a score of 81.2 in 2007. Dropping 4.9 points on the freedom index is the equivalent of dropping 1.76% in expected future returns given the past year’s correlation.
We believe this is one of the times when your asset allocation should tilt foreign and overweight the handful of countries with high economic freedom. Although many economists acknowledge that freedom matters, few investment strategies take advantage of this fact.
Disclosures: Our firm has been over weighting countries with the most economic freedom for several years. New subscribers to our blog receive free access to a 1.75 hour video presentation on “Where in the World to Invest?“